Trial
7-day trial
IceStoreLab is a new generation analytical service designed for online store owners, marketers, and eCommerce analysts. The service allows you to receive complete and structured information about the actions of competitors in a selected niche and region.
The service operates on the basis of automated parsing and advanced analysis of the actions of many online stores. The results are processed daily and delivered to you ready—made, without the need for technical configuration.
There are many competitor monitoring solutions on the market, but most of them are either limited in depth of analysis or require technical training and manual configuration. IceStoreLab offers a ready-made, automated service capable of covering both Shopify stores and stores on other platforms, with priority given to the most popular eCommerce systems.
We do not use universal lists. Each project is formed individually, taking into account its subject, geography, segment, and relevance. The main focus is on Shopify stores, but monitoring of other platforms is also possible.
The client receives the real domain names of the stores that are being analyzed, with active links to sources to see exactly where the data comes from.
IceStoreLab tracks the actions of competitors on a daily basis. This allows us to identify not only strategic changes (for example, the launch of new collections), but also tactical ones: promotions, seasonal offers, quick sales, disappearance of goods, etc.
Information is delivered in familiar and convenient formats.:
This frees you from having to log in to the dashboard or open complex tables — everything comes to where you are already working.
Each report is complemented by an analytical section with conclusions and recommendations, which are generated using AI algorithms. This allows you not only to see the changes, but also to understand what they mean, how they affect market behavior, and what actions may be relevant in response.
All information is collected exclusively from open sources, without access to administrative panels or confidential competitor data. Public examples of reports can be anonymized, but the customer always gets access to the full list of analyzed sites.

Summary report on the dynamics of products and options in the catalog over the past few days. The data is presented in a visual table using bright icons, which allows you to quickly understand the key changes.
✅️ 21 products have become available
❗ 2 variants of the product were sold out
🔺 11 products increased in price
🔻 2 products have decreased in price
⛔ 88 products were deleted
➕ 71 new products
✏️ 3 products renamed
This report provides a complete picture of the current status of the competitor's product catalog.
The table is dynamic. For each value, you can go to detailed information, for example, which products were added or deleted. The information is updated daily, which allows you to quickly track changes.

The report contains information about 13 products that were removed from the catalog. Each product is presented with its name, variations and corresponding prices. In some cases, size information is provided.
This report helps you understand which products were excluded from the range, their characteristics and cost at the time of removal.
The report is updated daily, ensuring that the data is up-to-date and allowing timely monitoring of changes in the product range.

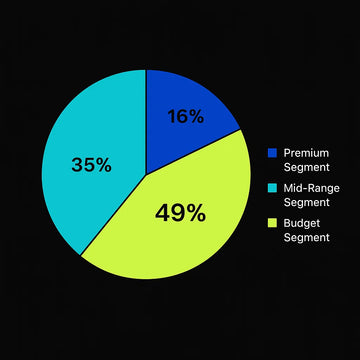
The pie chart shows the distribution of competitor's products between three price categories: budget, medium, and premium.
- The Budget Segment occupies a leading position with a 49% share, which indicates a high demand for affordable goods or services.
- The Mid-Range Segment is 35% and reflects the steady consumer interest in balanced price and quality solutions.
- The Premium Segment is 16%, it attracts customers who are willing to pay more for high quality and status.
This chart clearly shows the price structure of a competitor's products and helps in strategic planning. Bright colors and clear data presentation make it easy to analyze and perceive information.
The chart is dynamic — when clicked, you can get more detailed information on each segment. The data is updated daily, which allows you to track changes in real time.

The report is a list of 17 new products, each with a unique name. Each product is available in different versions (Standard and Deluxe), with corresponding prices indicated. Some products are presented in only one version.
This report helps you quickly familiarize yourself with the competitor's new offers, their cost, and possible choices.
The report is updated daily, which allows you to track the appearance of new products in a competitor's catalog in a timely manner.

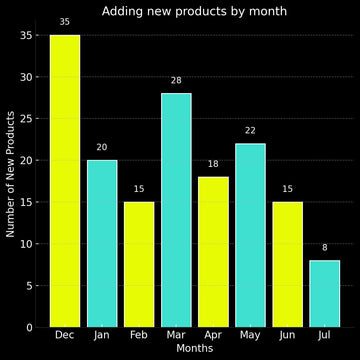
The presented bar chart shows the dynamic growth and decrease in the number of new products added each month.
- December is leading the way with a record high of 35 new products, indicating a seasonal peak.
- January and March also show strong results with 20 and 28 products, respectively, emphasizing the stability of development.
- There is moderate growth in February, April and May, where the number of new products ranges from 15 to 22.
- By June and July, there was a noticeable decline, reaching a minimum of 8 new products in July, which may be due to seasonal factors or production interruptions.
This chart clearly demonstrates the monthly changes in the competitor's activities.
The chart is dynamic. When you clicked, you can get more detailed data for each month. The information is updated daily, ensuring the relevance and accuracy of the analysis.

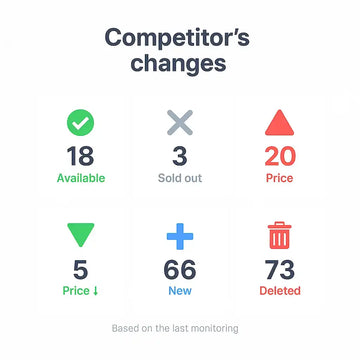
Infographic “Competitor Changes” is a clear, visual summary of key metrics automatically generated by our service after each monitoring cycle. Within seconds, you can see how many products are back in stock, which items are completely sold out, where prices have increased or dropped, as well as what new products the competitor has added or removed from their shelves. Large numbers and color markers help you instantly grasp assortment dynamics without combing through long tables or doing manual calculations.
Clicking on any card reveals a detailed breakdown of changes by SKU, date, and previous values—making trend analysis and purchase planning easier. Flexible settings allow you to filter by specific categories or competitors, set up notifications, and export the data.
The IceStoreLab service is built on a modular principle and includes three key stages. This provides maximum flexibility and business value, from manual customization to full automation of competitive intelligence and analysis.

At the first stage, a unique list of online stores corresponding to the selected niche and region is formed. The main focus is on Shopify, but stores on other platforms can also be enabled on request.
The selection is done manually and automatically, taking into account:
- Geographical area (country, region, city)
- Thematic focus (niche, product category)
- Size and activity of stores (assortment, availability of promotions, new products)
- Customer's wishes (for example, specific competitors or exceptions)
The client receives:
- A complete list of domain names and active links to competitors' websites.
- Transparency of data sources and the ability to manually check the relevance of the sample.

After agreeing on the list, daily monitoring of competing stores is launched. IceStoreLab automatically monitors and captures all changes, including:
- The appearance of new products;
- Removing items from the assortment;
- Price changes;
- Changing the availability status;
- Launching and completing discounts, promotions, and sales;
- Modification of options (size, color, packaging, etc.).
All data is stored with timestamps, and can be analyzed in any historical perspective. There is no rigid binding to a fixed period: you can go back to the changes for a day, a week, a month, or any time interval.
This gives:
- The ability to "rewind" and study the behavior of competitors at any time;
- High detail — for spot, "scalpel" analysis;
- A reliable basis for identifying patterns in the actions of competitors.

Based on the collected data, a daily analytical report is generated, including:
- An overview of each competitor's key changes;
- Generalized trends and frequency of actions for a group of stores;
- Table of price changes, availability, and share of new products;
- Conclusions and comments compiled using artificial intelligence;
- Simplified recommendations for actions (reaction to promotions, price changes, product range expansion).
Delivery formats:
- Daily — analytical reports in Telegram and/or by email;
- On request, a weekly or monthly review with more in—depth analysis and conclusions (HTML and PDF).
This allows you to:
- Quickly respond to competitor changes;
- Use reports in marketing, purchasing, and product planning.;
- Understand not just “what is happening,“ but ”why“ and ”what to do.”
7-day trial
An affordable way to gain control over the prices and assortment of competitors without additional investments in analytics.
Improve the accuracy of your decisions and reduce manual monitoring time by frequently updating product analytics.
Maintain dynamic pricing and manage your product range in real time, minimizing price differences with competitors.
Gain a strategic advantage using deep historical insights and real-time monitoring, essential tools for large online retailers.
Payment is made through a secure system.
IceStoreLab works as a fully autonomous analytical service — no complicated settings, API connection or data download from the client is required.
We collect, analyze and package the information ourselves into ready-made reports that are delivered directly to convenient channels. The service is focused on simplicity and maximum transparency.
Every day you receive a report with key changes and conclusions on selected sites:
📬 Email — with an HTML report and a PDF file;
💬 Telegram bot — a short summary in the messenger with the ability to open the full report via the link.
At the request of the client, you can connect additional recipients or change the delivery format (for example, Telegram only or Email only).
IceStoreLab is created as a fully managed service: you don't waste time on technical setup, data selection or integration — everything is done by our team. The connection takes a minimum of time and takes place in 3 simple steps.
To launch, we receive basic information from you:
💬 This information can be sent via a form, Telegram chat, or personal consultation.
We independently create a list of relevant stores with domain names and active links. We take into account both open data and the client's wishes.
IceStoreLab can be tested within 7 days for just $10 per site.
All functions are available during the trial period:
This allows you to verify the effectiveness of the service without risk.
IceStoreLab reports are not just analytics, but a tool for operational and strategic decisions. Thanks to the daily detail, clear structure and ready conclusions, you will be able to use them in various departments and management levels.
This is how our clients apply reports in practice:
Each report contains AI comments that formulate:
This helps to make decisions even for those who do not delve into the details of tables and graphs.
IceStoreLab gives you: